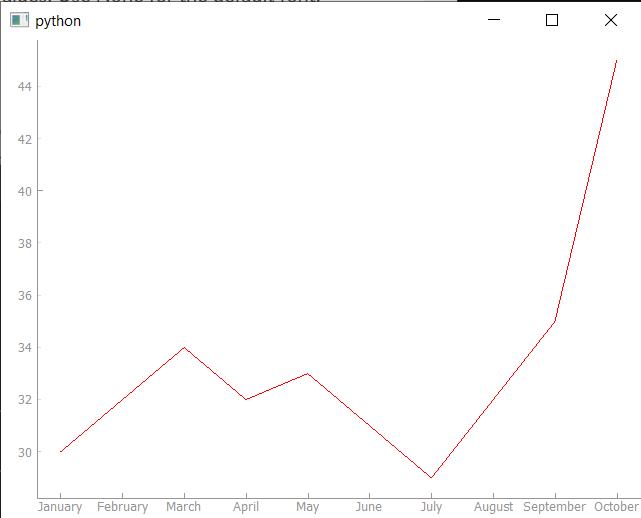
Is there a way to change the tics in a line graph to dates or names of months?
Hey, here you go.
from PyQt5 import QtWidgets
from pyqtgraph import PlotWidget, plot
import pyqtgraph as pg
import sys  # We need sys so that we can pass argv to QApplication
import os
import datetime

class MainWindow(QtWidgets.QMainWindow):

    def __init__(self, *args, **kwargs):
        super(MainWindow, self).__init__(*args, **kwargs)

        self.graphWidget = pg.PlotWidget()
        self.setCentralWidget(self.graphWidget)

        months = [1,2,3,4,5,6,7,8,9,10]
        temperature = [30,32,34,32,33,31,29,32,35,45]

        self.graphWidget.setBackground('w')

        pen = pg.mkPen(color=(255, 0, 0))

        month_labels = [
            # Generate a list of tuples (x_value, x_label)
            (m, datetime.date(2020, m, 1).strftime('%B'))
            for m in months
        ]
        self.graphWidget.plot(months, temperature, pen=pen, labels=month_labels)

        ax=self.graphWidget.getAxis('bottom')
        # Pass the list in, *in* a list.
        ax.setTicks([month_labels])


def main():
    app = QtWidgets.QApplication(sys.argv)
    main = MainWindow()
    main.show()
    sys.exit(app.exec_())


if __name__ == '__main__':
    main()
The trick is the labels need to be a list of 2-tuples containing the tick value (x value) and the label for that tick. In the example above we’re using month numbers 1-10 for the x-axis, so the month labels becomes [(1, "January"), (2, "February"), (3, "March") ... etc]
To set the labels you need to get the axis object, and then use .setTicks() …since this can be used to set ticks for both axes, you need to pass it in in a list i.e. [month_labels] where month_labels is our list of tick labels.
The result is …
Hope that helps?
