I followed the Embed PyQtgraph tutorial. I tried to write the code to use PySide2. But I don’t find the equivalent function to remplace graphWidget (PyQt5). Do you have any suggestion?
# from PyQt5 import QtWidgets, uic # import for PyQt
from PySide2 import QtWidgets
from qtpy import uic
import sys # We need sys so that we can pass argv to QApplication
class MainWindow(QtWidgets.QMainWindow):
def __init__(self, *args, **kwargs):
super(MainWindow, self).__init__(*args, **kwargs)
uic.loadUi('mainwindow.ui', self) # Load the UI Page
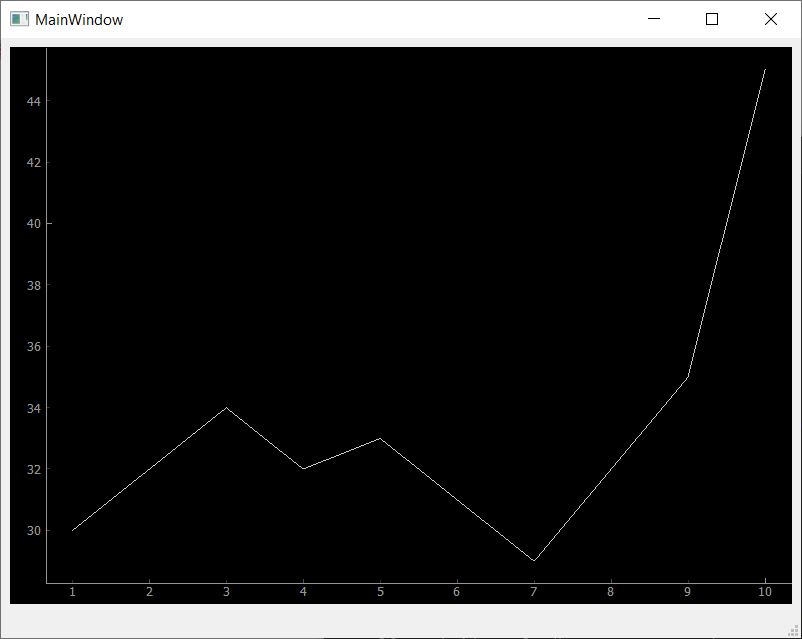
self.plot([1, 2, 3, 4, 5, 6, 7, 8, 9, 10], [30, 32, 34, 32, 33, 31, 29, 32, 35, 45])
def plot(self, hour, temperature):
self.plot(hour, temperature) # PySide2, work but plot out the main window
# self.graphWidget.plot(hour, temperature) # PyQt5
def main():
app = QtWidgets.QApplication(sys.argv)
main = MainWindow()
main.show()
sys.exit(app.exec_())
if __name__ == '__main__':
main()
Hi Adri,
graphWidget is not a function of PyQt5.
graphWidget is an instance of the class PlotWidget imported from the pyqtgraph.
Try to read the tutorial again.